In working with the PhysioNet Challenge 2012 data set, it can often be very difficult to assess the condition of a given patient, or the trends within those the time series variables provided.
There is a lot of variability between the number of variables recorded (and the number of observations per variable) for each patient. As a medical data set, the data is characterized by highly non-linear trends, and it can be difficult to get a handle on it in a table format. Worse, the training set is nearly 2 million rows long when training patient data is joined together — a result of presenting patient data in three rows: Time, Parameter, Value.
Furthermore, there is a large variation in the reliability of the data recorded in each variable. A machine-read variable may be more reliable than a variable whose observations are recorded by hand by a human.
Thus, in exploring the data set, it may be useful at times to visually see the input data validate model output or to explore unusual cases or values. R provides a straight-forward language with good packages for pretty graphs, making it a good choice for this type of visualization.
A nice looking plot
This post will help you learn to run R code that produce graphs like this. (Note: learn to run, not learn to write… that’s a much longer post and maybe I’ll get to it later.)
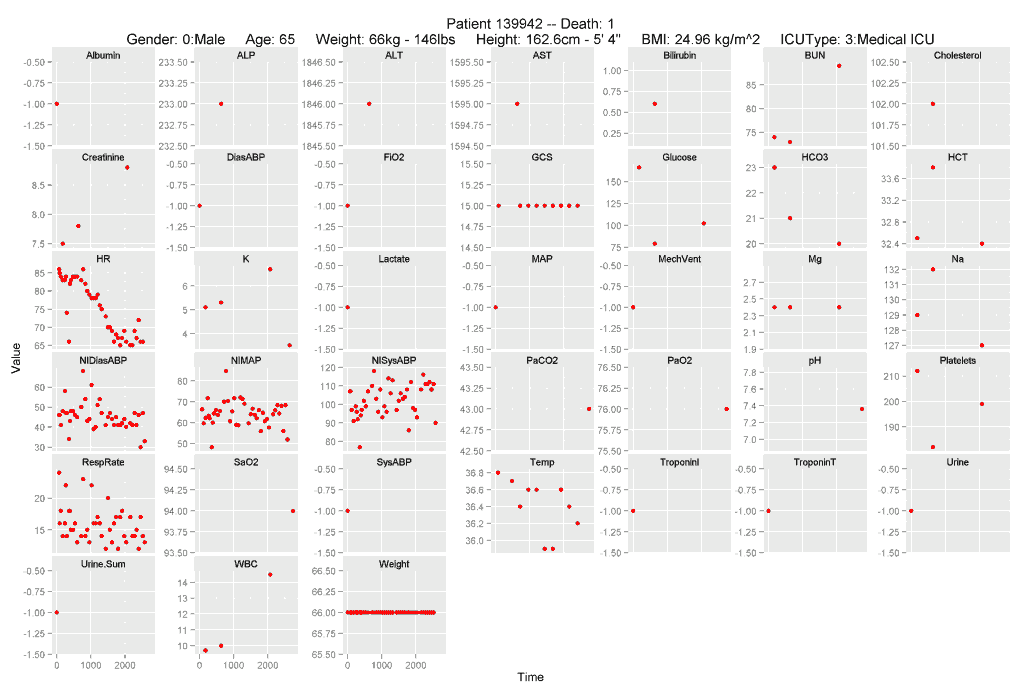
The image shows all of the time-series variables available for patients in Set A, ordered alphabetically, with a fixed time scale in minutes after arrival in the ICU. Descriptive variables, including some calculated variables, are printed at the top of the plot.
The plot is generated by sending a list of RecordID’s to a function, plotByID(), which will either display the plot on the screen, or save it to the working directory.
Getting Started
First, download and install RStudio. This should be relatively painless. You’ll also need the code and the data set. The original data set is from the PhysioNet 2012 Computing in Cardiology. I’ve simply pulled each individual patient file into one dataset and added a new column for RecordID.
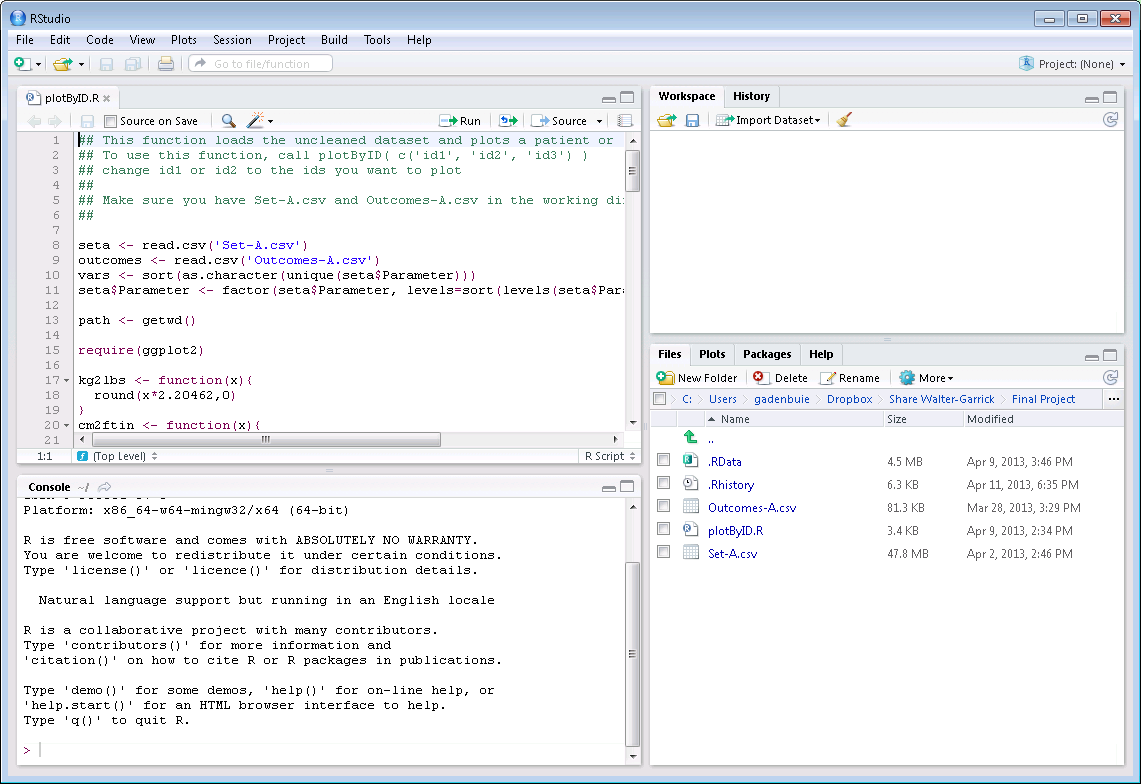
Extract plotByID.zip somewhere where you’ll find it and fire up RStudio. You should see a screen that looks a lot like this:
![]()
You’ve got the Console on the left, Workspace and Files on the right. This code uses Hadley Wickham’s excellent plotting package ggplot2, which isn’t installed by default. To install it, click on Install packages under the Tools menu, type ggplot2 in the text box and hit enter. Everything should install fine.
To load the code, click on the … in the Files pane and open the folder where you extracted the data set. To make sure everything runs within this directory, click “Set working directory” under the More button. Open plotByID.R. Now you should see this:
The code to load and plot the data is now open in the upper left window. Take a look at it and read through it if you want. To load it up, simply select everything (Ctrl/⌘+A) and then click Run or hit Ctrl/⌘+Enter. The data set and necessary functions will load, and the demo plot above will appear, like magic.
Using plotByID()
The plotting function is pretty self-explanatory. It takes a primary argument of a RecordID or a vector of RecordIDs and returns a plot. There are also arguments to save the plot to a particular path and to control whether or not the plot displays on the screen.
To plot input patient data to the screen you only have to enter one RecordID, by simply typing
plotByID(133966)in the console and hitting enter. To plot multiple patients, use a vector, which in R is denoted by the command c(). Thus,
plotByID( c(133966, 140334) )will plot the input data for two patients. To plot a random sample of 10 patients use the sample() function:
plotByID( sample(seta$RecordID, 10 )If you want the images to save to the working directory, use
plotByID(133966, save=TRUE, path=path)You don’t have to manually specify the path variable, it’s been set to the working directory. If you want to change the saving path, set
path="~/Your/Directory/Here"That’s it. I hope this makes it a little easier to see what you’re working with! ;)