# library(tidyverse)
library(dplyr)
library(purrr)
library(tidyr)
library(forcats)
library(ggplot2)
library(lubridate)I was working on prioritizing some long term projects today and decided that the one thing that would help me gain some clarity would be a weekly planner. Rather than waste hours of productive time fighting popups and banner adds on the million and a half SEO-fueled malware-laden “free printable calendar” websites, I decided to waste not quite as many hours of productive time creating the exact calendar I wanted using ggplot2.
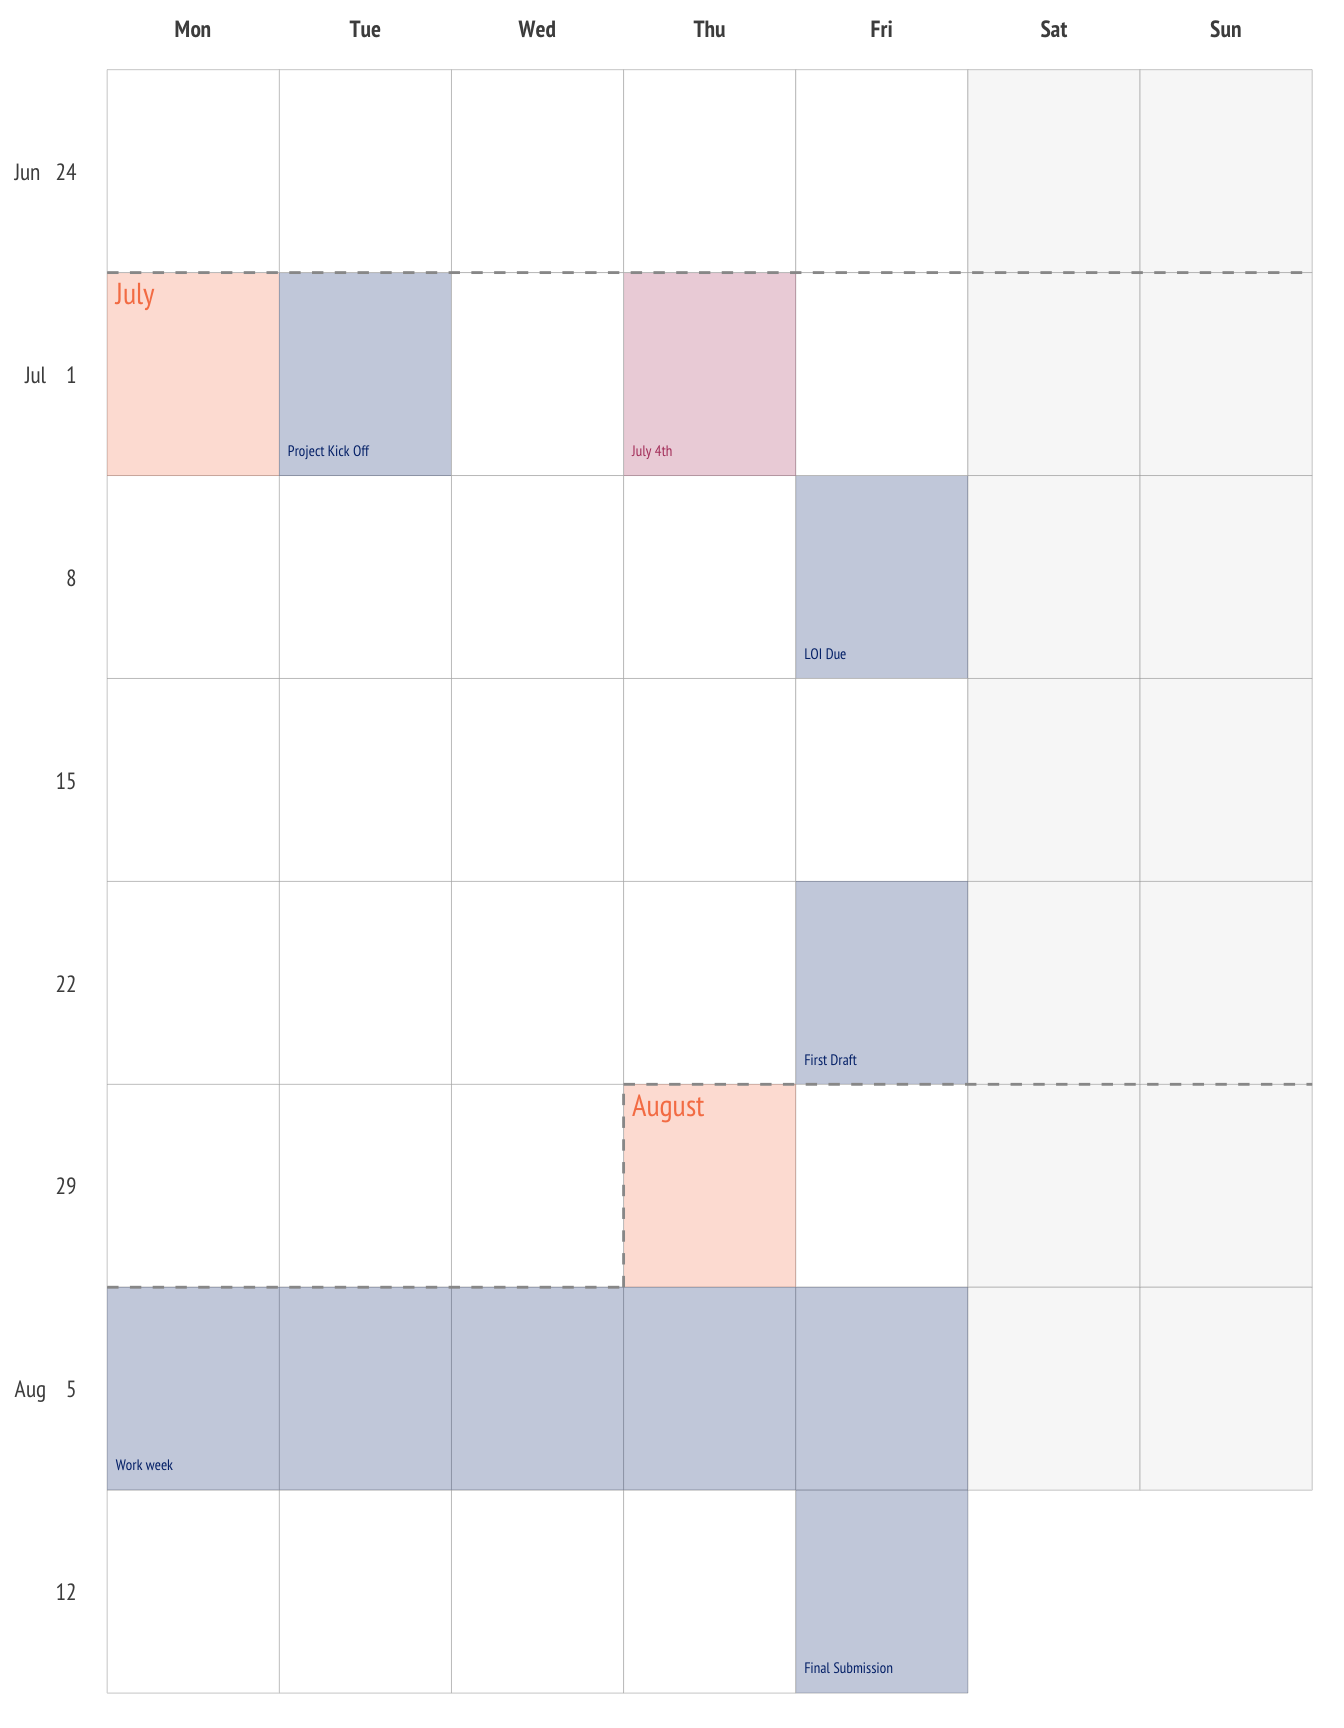
Here’s the end result: a simple calendar where each week is a row. Weeks start on Mondays because that’s when a new week starts. Important dates can be highlighted, for holidays or other days relevant to your projects.
I doubt it’s bullet journal certified, but it worked for me and maybe it will for you too.
I’ll break down the pieces that went into the calendar, but if you just want to make your own you can jump to the end use the ggweekly package I shared on GitHub and get straight to calendar printing and project planning.
Update: I realized it would be easier to share this code as a small R package rather than a gist or as a script embedded here. You can now install ggweekly from github.com/gadenbuie/ggweekly and use the ggweek_planner() function to make your own custom, printable calendars.
The Making of a Calendar
Load the tidyverse
First, we need to load the usual suspects from the tidyverse], plus the [lubridate package (because dates).
Let’s also save ourselves some extra typing and tell lubridate to always start weeks with Monday.
options("lubridate.week.start" = 1)Create a tibble of dates
Next, I set up a tibble of dates and associated information (day of the week, month, year, etc.) that I’ll need for the calendar grid. I start by finding the nearest previous Monday to the starting date and creating a sequence of dates.
start_day <- floor_date(ymd("2019-06-24"), "week")
end_day   <- ymd("2019-08-16")
seq_days  <- seq(start_day, end_day, by = "day")

seq_days[1:5]
[1] "2019-06-24" "2019-06-25" "2019-06-26" "2019-06-27" "2019-06-28"I’m also taking advantage of the fact that tibble() is similar to mutate() in that it allows you to create new columns that reference previous columns inside the tibble definition, rather than having a separate call to mutate().
dates <-
  tibble(
    day       = seq_days,
    wday_name = wday(day, label = TRUE, abbr = TRUE),
    weekend   = wday(day) > 5,
    isoweek   = isoweek(day),
    month     = month(day, label = TRUE, abbr = FALSE),
    isoyear   = isoyear(day),
    week_year = fct_rev(sprintf("%s - %s", isoyear, isoweek))
  )

dates
# A tibble: 54 × 7
day wday_name weekend isoweek month isoyear week_year
<date> <ord> <lgl> <dbl> <ord> <dbl> <fct>
1 2019-06-24 Mon FALSE 26 June 2019 2019 - 26
2 2019-06-25 Tue FALSE 26 June 2019 2019 - 26
3 2019-06-26 Wed FALSE 26 June 2019 2019 - 26
4 2019-06-27 Thu FALSE 26 June 2019 2019 - 26
5 2019-06-28 Fri FALSE 26 June 2019 2019 - 26
6 2019-06-29 Sat TRUE 26 June 2019 2019 - 26
7 2019-06-30 Sun TRUE 26 June 2019 2019 - 26
8 2019-07-01 Mon FALSE 27 July 2019 2019 - 27
9 2019-07-02 Tue FALSE 27 July 2019 2019 - 27
10 2019-07-03 Wed FALSE 27 July 2019 2019 - 27
# … with 44 more rowsNote that I’ve used isoweek() and isoyear(), which also follow the convention of starting the week on Monday. This way, I now have the week number to which each day in the sequence belongs, but because we may be interested in creating calendars that span multiple years, the addition of isoyear() protects against repeated week numbers.
This week year combination is destined for the y axis as it marks the row to which each day belongs. The y axis is typically increasing, with the smallest value at the bottom. This means that, if left as strings, the week of "2019 - 25" would be below the week "2019 - 26". Because calendars are typically read top to bottom, I used fct_rev() here to both convert {isoyear} - {isoweek} into a factor and then reverse the factor order so that 2019 - 25 is the last factor.
# shows the _last 6_ week_year factor levels
dates %>% pull(week_year) %>% levels() %>% tail()
[1] "2019 - 31" "2019 - 30" "2019 - 29" "2019 - 28" "2019 - 27" "2019 - 26"For a bit of convenience later, I then pull out the rows of dates representing the first day of the month, to use later when adding the colored boxes and text labels marking the start of a new month.
day_one <- dates %>%
  filter(day(day) == 1)

day_one
# A tibble: 2 × 7
day wday_name weekend isoweek month isoyear week_year
<date> <ord> <lgl> <dbl> <ord> <dbl> <fct>
1 2019-07-01 Mon FALSE 27 July 2019 2019 - 27
2 2019-08-01 Thu FALSE 31 August 2019 2019 - 31Better week labels
Quick, what’s the starting date of week 31 in 2019?
Ok, fine, that was too hard. What month of 2019 does week 31 belong to?
Trick question: that week starts on July 29, 2019 but ends on August 4th.
So… we need better axis labels than 2019 - 31. A reasonable replacement would be to use the day of the month of the week’s starting day.
The following code filters dates to include the first day of each week (hint: it’s Monday). Then, I use month(day, label = TRUE) to get the abbreviated month name (abbr = TRUE is the default) that I’ll append to the day of the month of each day.
But when a given week is preceded by a week from the same month, it would be visually distracting to see Jul repeated with each date — Jul 1, Jul 8, Jul 15, and so on — in the axis labels. For easy scanning, I only included the month in the label if the month changed from the month before. In other words, when month == lag(month), I just need the day of the month the given week.
week_start_labels <- dates %>%
  filter(wday_name == "Mon") %>%
  arrange(day) %>%
  mutate(
    month = month(day, label = TRUE),
    label = case_when(
      month == lag(month) ~ paste(day(day)),
      TRUE ~ sprintf("%s %4i", month, day(day))
    )
  ) %>%
  select(label, week_year) %>%
  reduce(setNames)
The last two lines there are a neat trick to take a two column tibble (or a two-element list) and convert it into a named vector using purrr::reduce(). The first argument becomes the vector values and second argument becomes the vector names:
list(1:5, letters[1:5]) %>% purrr::reduce(setNames)a b c d e
1 2 3 4 5 A special tibble for special days
I used yet another tibble to store holidays and other important dates related to the project. Each day can have a label, color, and/or fill.
highlight_days <- tribble(
         ~ day,            ~ label,   ~ color,    ~ fill,
  "2019-07-02", "Project Kick Off", "#02307a", "#02307a",
  "2019-07-04",         "July 4th", "#b4436c", "#b4436c",
  "2019-07-12",          "LOI Due", "#02307a", "#02307a",
  "2019-07-26",      "First Draft", "#02307a", "#02307a",
  "2019-08-05",        "Work week", "#02307a", "#02307a",
  "2019-08-06",                 "",        NA, "#02307a",
  "2019-08-07",                 "",        NA, "#02307a",
  "2019-08-08",                 "",        NA, "#02307a",
  "2019-08-09",                 "",        NA, "#02307a",
  "2019-08-16", "Final Submission", "#02307a", "#02307a"
) %>%
  mutate_at(vars(day), ymd)
Finally, ggplot the calendar
Finally, we arrive at the main event, the actual creation of the calendar with ggplot2.
Here I use geom_tile() for each day, and then overlay tiles for the start-of-the-month days and the highlighted holiday and project-specific days. I also used geom_text() to add annotations to the special days, which I pushed to the top or bottom left corner of the day box.
Code to produce the calendar
gcal <-
  dates %>%
  mutate(
    # Softly fill in the weekend days
    weekend = case_when(weekend ~ "#f8f8f8", TRUE ~ "#FFFFFF")
  ) %>%
  ggplot() +
  aes(wday_name, week_year) +
  # the calendar grid
  geom_tile(aes(fill = weekend), color = "#aaaaaa") +
  # highlight first day of each month
  geom_tile(
    data = day_one,
    fill = "#f78154",
    alpha = 0.25,
    width = 1,
    height = 1
  ) +
  # add name of month to the first day
  geom_text(
    data = day_one,
    aes(label = month),
    family = "PT Sans Narrow",
    color = "#f78154",
    size = 4,
    # push text to the top left corner
    hjust = 0,
    nudge_x = -0.45,
    vjust = 1,
    nudge_y = 0.45
  ) +
  # highlight project-specific days
  geom_tile(
    data = dates %>% inner_join(highlight_days, by = "day"),
    aes(fill = fill),
    alpha = 0.25
  ) +
  # add the label from the highlighted days
  geom_text(
    data = dates %>% inner_join(highlight_days, by = "day"),
    aes(label = label, color = color),
    family = "PT Sans Narrow",
    size = 2,
    # push to bottom left corner
    hjust = 0,
    nudge_x = -0.45,
    vjust = 0,
    nudge_y = -0.40
  ) +
  scale_x_discrete(position = "top") +
  scale_y_discrete(labels = week_start_labels) +
  scale_fill_identity() +
  scale_color_identity() +
  guides(fill = FALSE) +
  theme_minimal(base_family = "PT Sans") +
  theme(
    axis.text = element_text("PT Sans Narrow"),
    axis.title = element_blank(),
    panel.grid = element_blank(),
    axis.text.x.top = element_text(face = "bold"),
    axis.title.x.top = element_blank(),
  )

gcal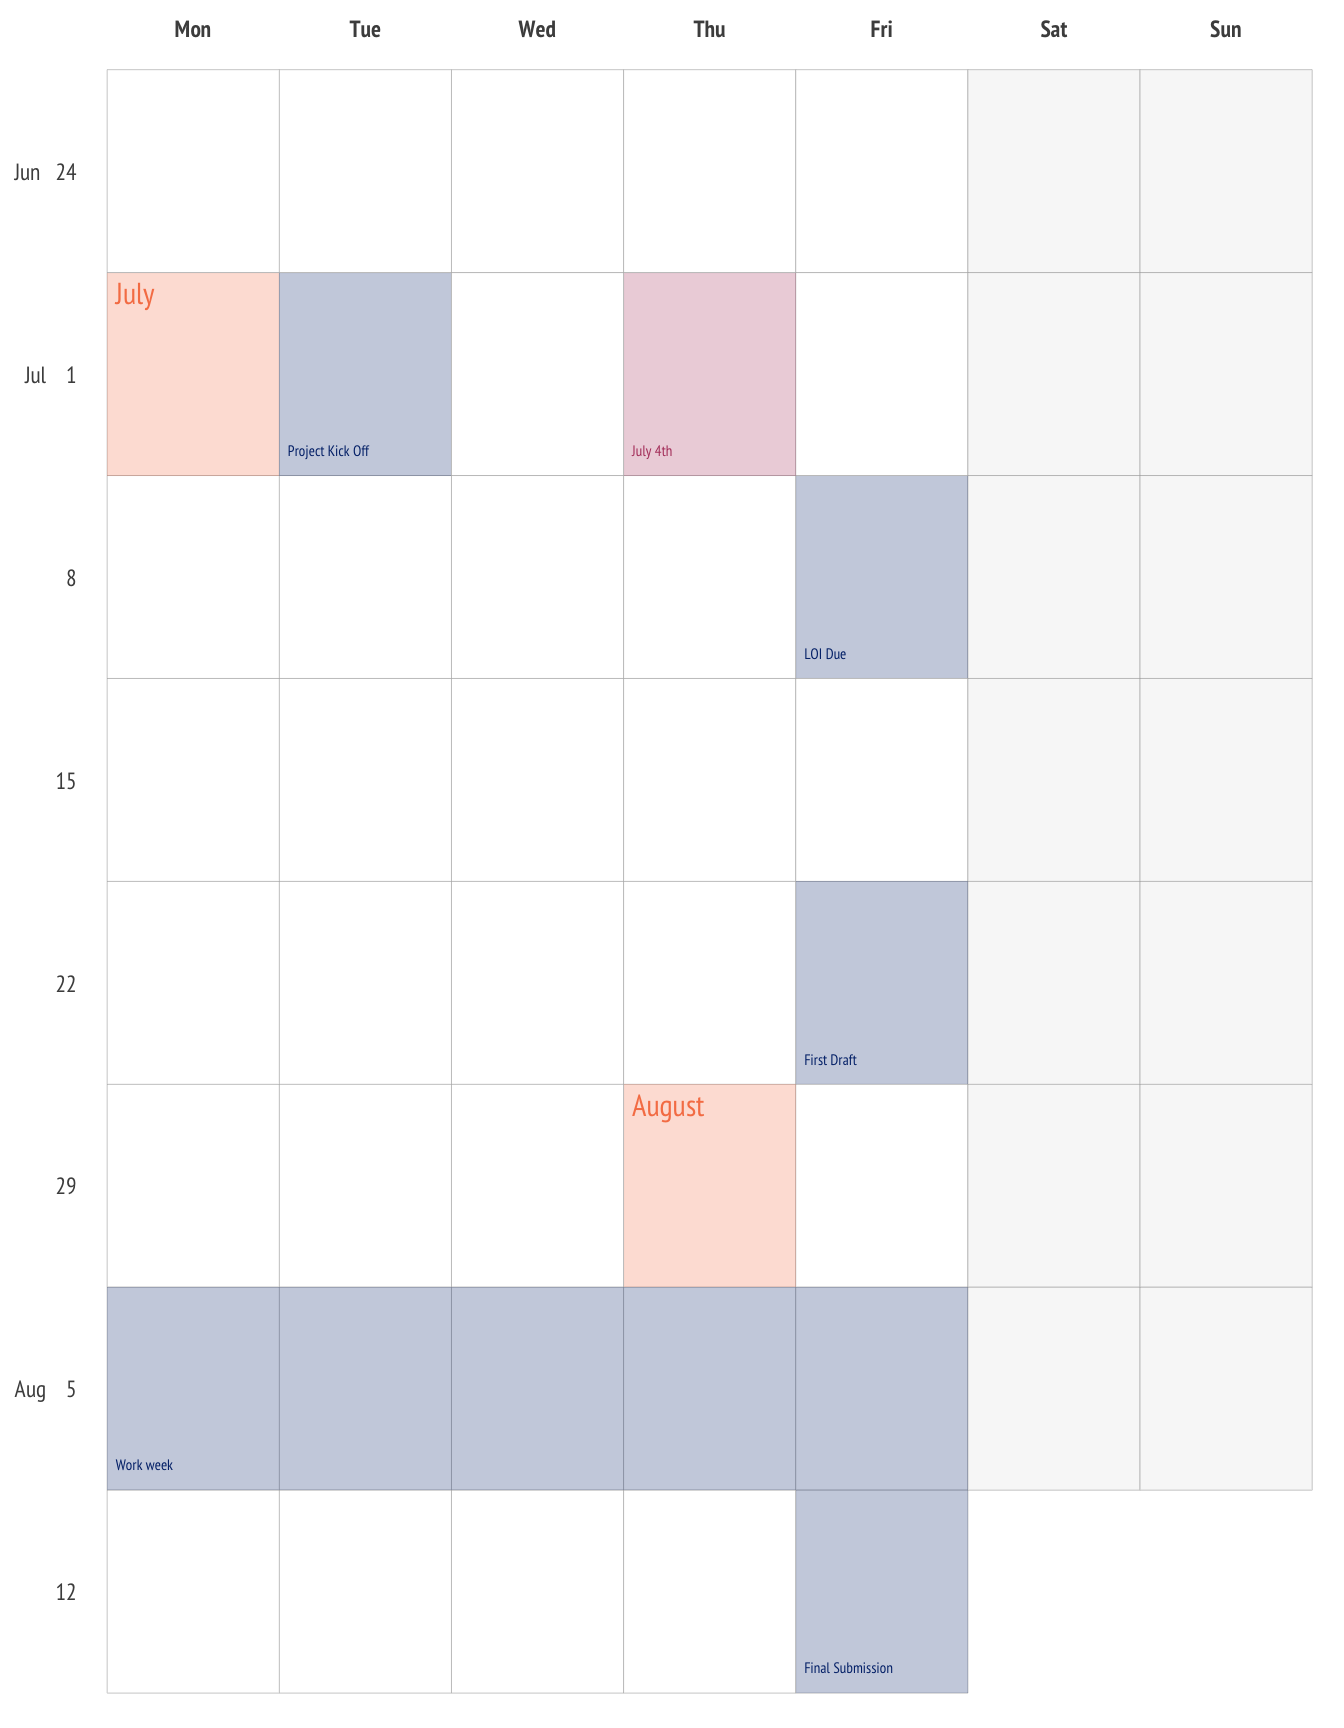
Calculate month boundaries
For a final touch, I wanted stronger differentiation between months. In the following code, I convert wday_name and week_year into integers that indicate the center point of each box.
Then, using the fact that the top and bottom (and right and left) sides of the box are +/- 0.5 units from the center, I create three line segments. The first extends from the bottom left corner of the day starting the week with the month change (left side of the plot) until the left edge of the box representing the start of the next month. The second segment line travels up the left edge of that box. And the third and final segment travels from the top left corner of the month-changing day to the right edge of the plot.
month_boundaries <- day_one %>%
  select(day, month, wday_name, week_year) %>%
  mutate_at(vars(wday_name, week_year), as.integer) %>%
  mutate(
    left = map2(wday_name, week_year, ~ {
      # n/a if month changes on first day
      if (.x == 1) return(tibble(.missing = NA))
      tibble(
        x = 0.5,      xend = .x - 0.5,
        y = .y - 0.5, yend = y
      )
    }),
    up = map2(wday_name, week_year, ~ {
      # n/a if month changes on first day
      if (.x == 1) return(tibble(.missing = NA))
      tibble(
        x = .x - 0.5, xend = x,
        y = .y - 0.5, yend = .y + 0.5
      )
    }),
    right = map2(wday_name, week_year, ~ {
      tibble(
        x = .x - 0.5, xend = 7.5,
        y = .y + 0.5, yend = y
      )
    })
  )


month_boundaries
# A tibble: 2 × 7
day month wday_name week_year left up right
<date> <ord> <int> <int> <list> <list> <list>
1 2019-07-01 July 1 7 <tibble [1 × 1]> <tibble> <tibble>
2 2019-08-01 August 4 3 <tibble [1 × 4]> <tibble> <tibble>Then, I use a quick for loop to add each of these segments to the calendar plot.
for (boundary in c("left", "up", "right")) {
  gcal <- gcal +
    geom_segment(
      data = month_boundaries %>% unnest(!!rlang::sym(boundary)),
      aes(x = x, y = y, xend = xend, yend = yend),
      color = "#999999",
      linetype = 2
    )
}

gcal
A Weekly Planner Package
I originally thought I would simply include the code as a gist and move on with life, but I quickly realized that I might want to a) use this code again sometime and b) find some room for improvement and tweaks.
So I created ggweekly, a small package for creating calendars like these. In packaging the code, I made a few tweaks and changes. For example, I scraped the dates of federal holidays from the U.S. Office of Personel Management and separated the highlighted and holiday days. I also tweaked the function signatures a bit to make it more flexible.
Check out the package at github.com/gadenbue/ggweekly and happy planning!
devtools::install_github("gadenbuie/ggweekly")

# create a calendar for April, May and June
library(ggweekly)
ggweek_planner(
  start_day = "2019-04-01",
  end_day = "2019-06-30",
)