I’m going to show you a quick-and-dirty way to use Google Forms and a smartphone for in-the-field data collection. Of course, for me “in-the-field data collection” really means keeping track of how much I weigh or how many cups of coffee I drank, but Google Forms is a powerful and versatile online form platform that can do a whole lot more.
I’ve tried other “life logging” apps, and while they’re useful at times, I’ve found that all I really want is an easy to update spreadsheet. It turns out that a link to a Google Form on my iPhone is the perfect balance between ease and control.
So far, I’ve used this method as a time card to track working hours, to track my daily weight, to stay on top of a group project, and to monitor the chemical balance and consumption of my pool. With Google Forms it’s easy to design a form that specifically fits your needs – I’m sure there are a lot of other great ways this setup could be used.
Create the form
Fire up Google Docs and create a new form from the “Create” button. Give your form a name and pick a theme. The simpler themes tend to look better on mobile browsers; I tend to pick Dark Grey, but today I chose Magazine.
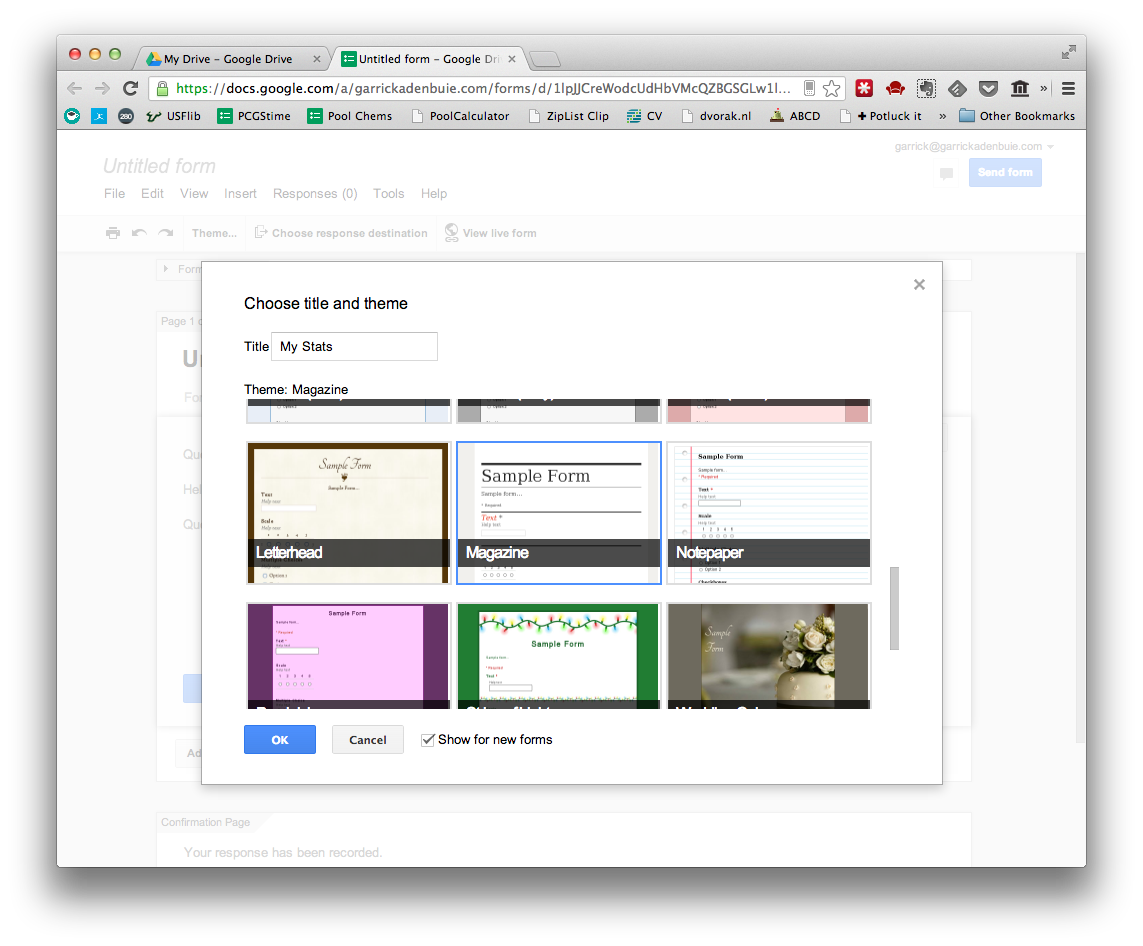
Google will ask you if you want to save the responses in a separate spreadsheet, which seems like a good idea. Give the spreadsheet the name you want and move to the next step… actually building the form.
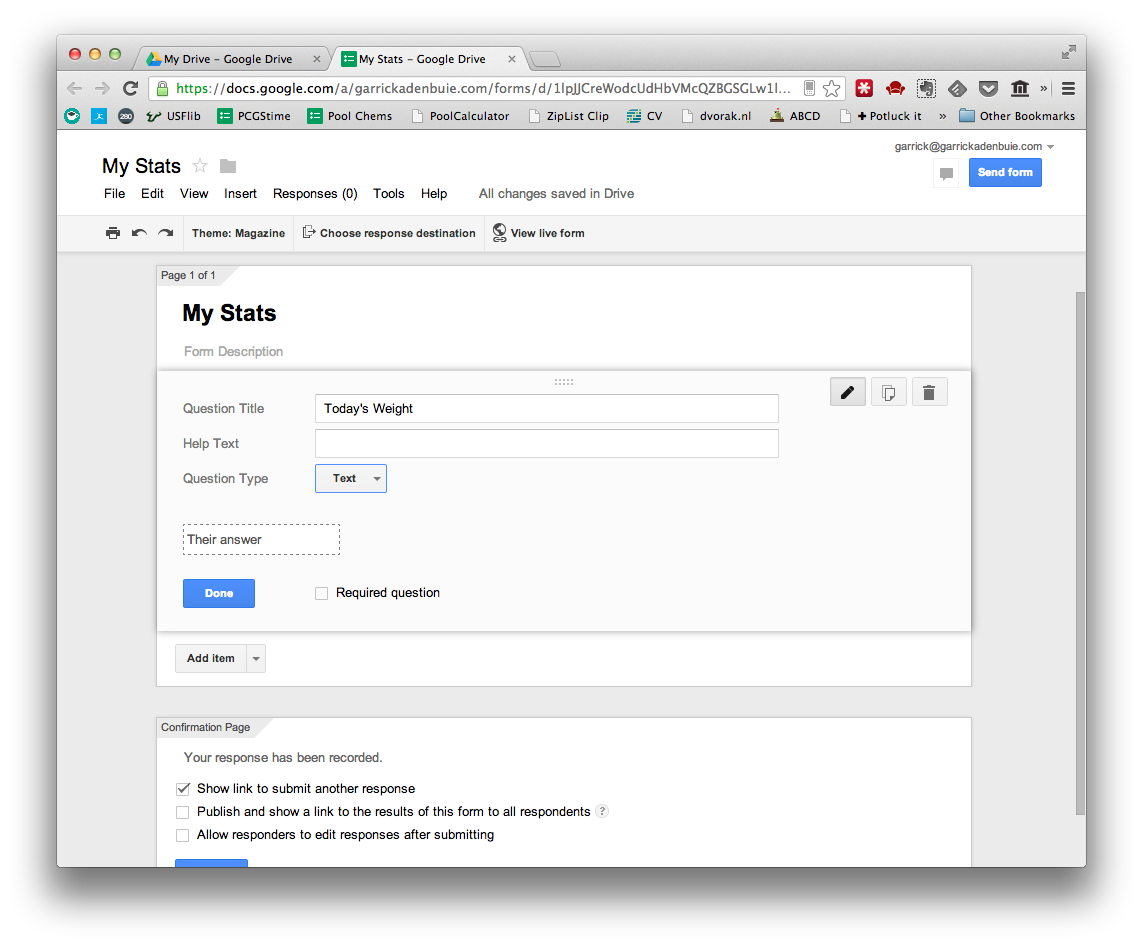
Add the form items that you need, and try to find a balance between ease of collection and integrity of the data. I’ve found that for numerical entries, the Plain Text format works best. If you want to allow multiple selections from a predetermined list, choose Checkboxes and then add your options. These will be stored in your spreadsheet as a single cell with a list of the selected options, ie: "Option 1, Option 3". You can also have a slider input on a scale of 1-5 or 0-10, but if precision is important – eg. you might need to record 6.7 – then skip this and use the plain text format.
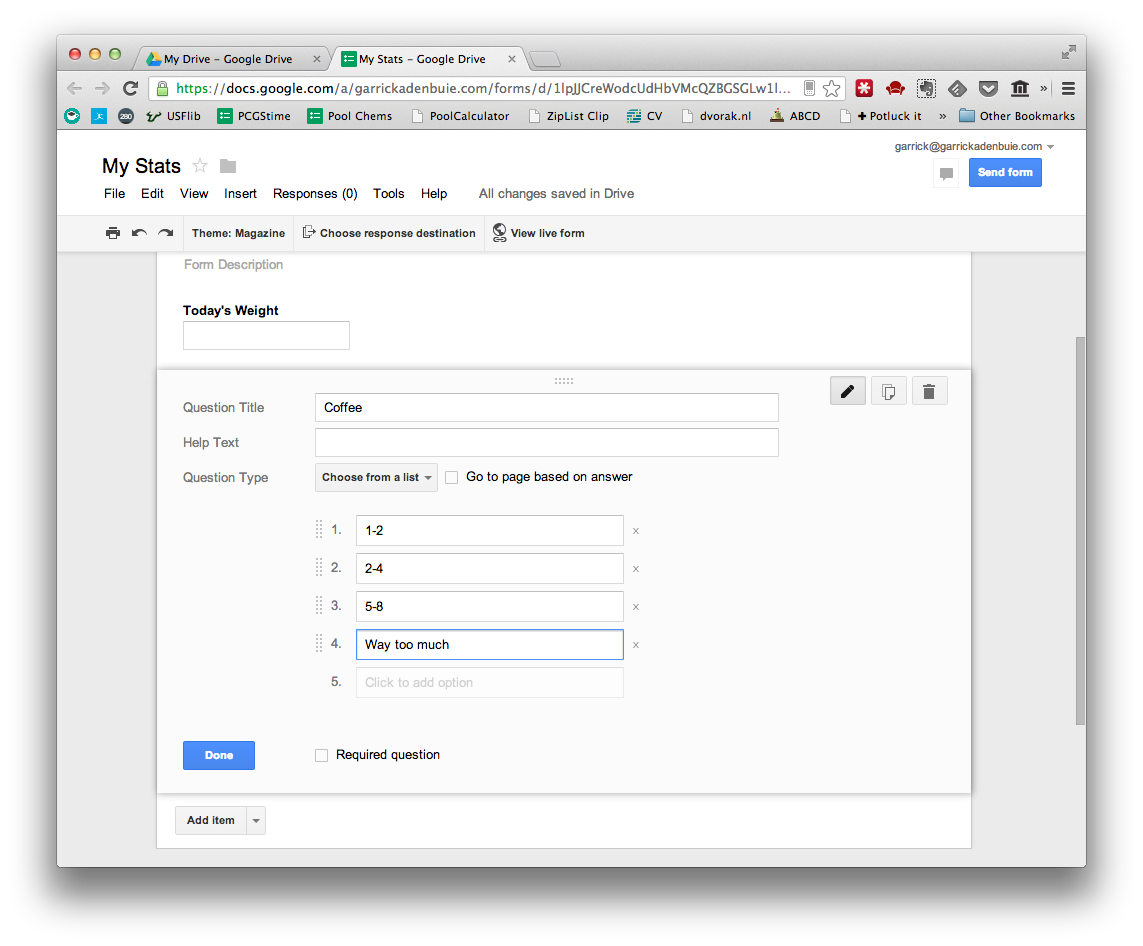
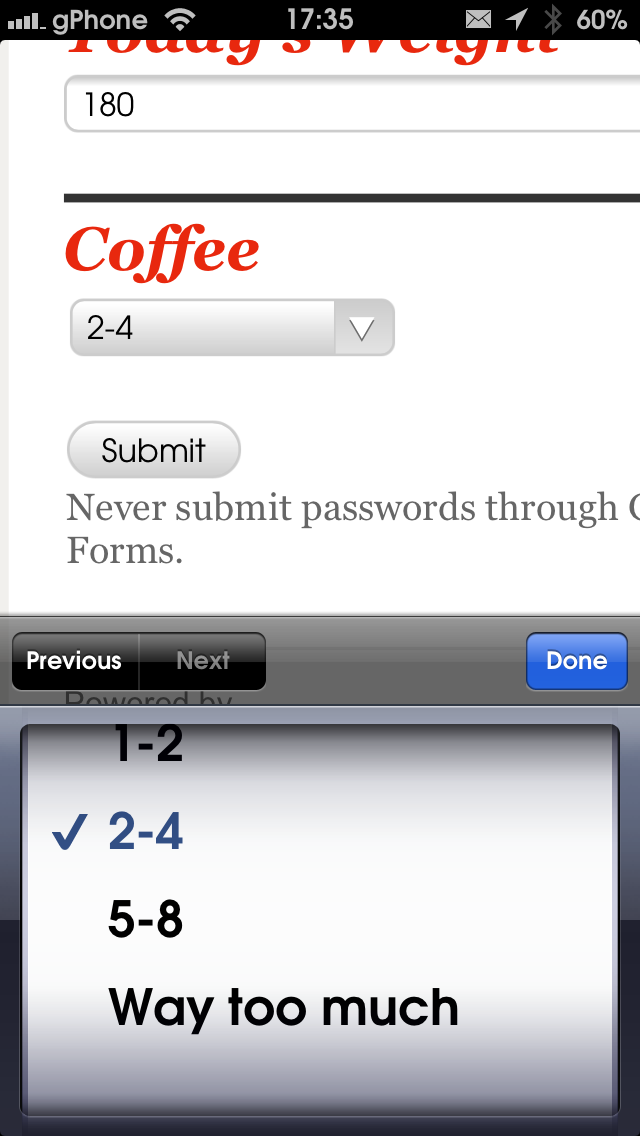
For a the select only one option type item, the Choose from a list option works best, and shows up on the iPhone as a rolodex list. As an example, I’ve added a question for the number of cups of coffee I’ve had today.
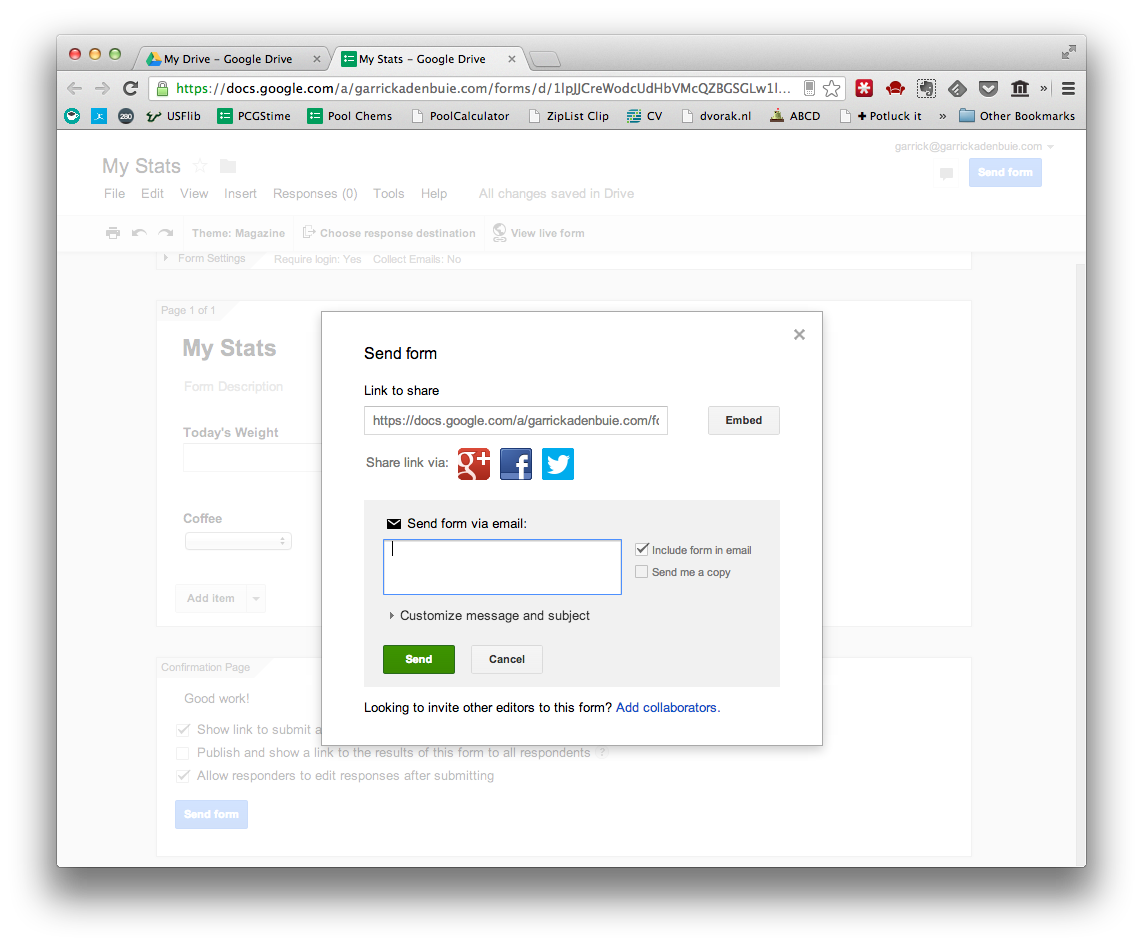
When you’re done with the questions, edit the form submitted confirmation response to something validating, like Good work, dude!, and decide if you want to allow edits. Then click Send Form and send the form to an email address that gets delivered to your phone.
Get smart with your phone
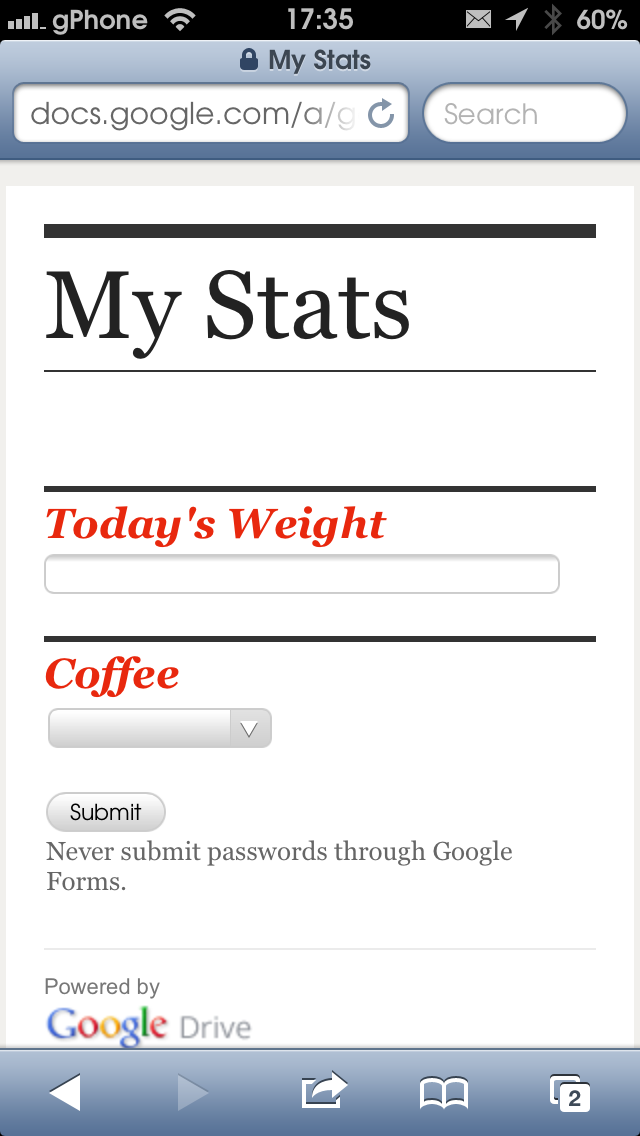
Check your email on your phone and pull up the form you just created. It should look something like this.
Enter your first data item. Here you can see the “rolodex” selector is easy to use for a short list of about 5 or less options.
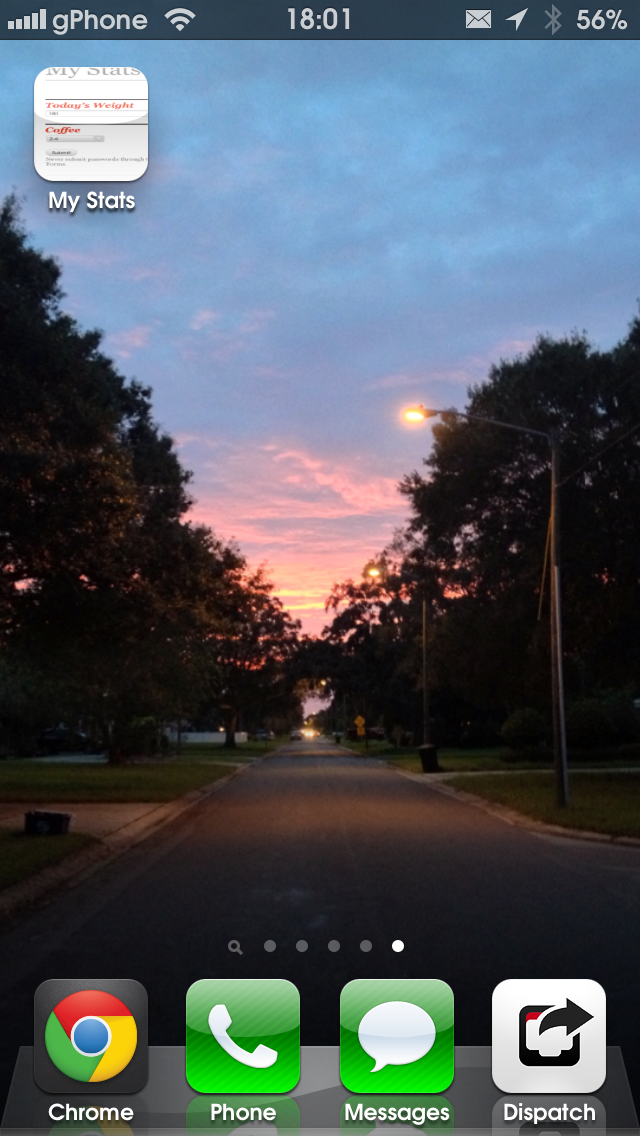
If you’re using Safari, then while you’re on the form page, tap the bookmark button and choose Add to Home Screen. Make sure you give the new link a short name so it displays nicely on the home screen. Now you’ve got easy access to your form from your phone.
Spreadsheets
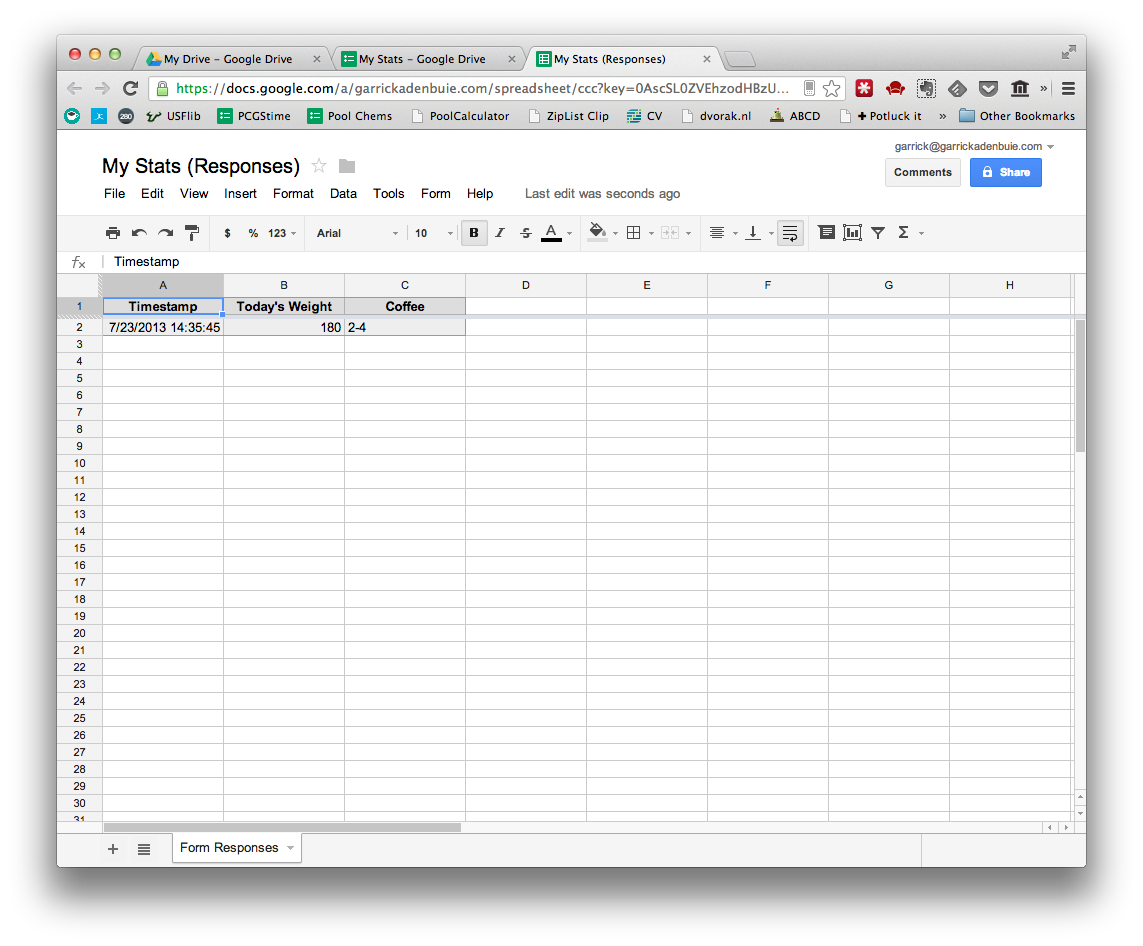
Now that you’re set up with easy data collection from your phone, you’ll want to do something with the data you’re collecting. All of the entries you submit are collected by Google into a spreadsheet you named at the beginning of the process.
From here you can create graphs and charts, calculate summary statistics, etc. Everything a spreadsheet was meant to be. Of course, it’s best to do any calculations on a new sheet so that your work isn’t lost when new responses are recorded. One limitation I’ve found is that columns are added to the spreadsheet as the items are added, so if you add a new item or rearrange questions in your form, the spreadsheet columns will be disorganized.
One of the greatest benefits of using Google Forms is that every entry is time stamped. Google’s timeline visualization is excellent, and once you have the data together it’s as easy as adding a chart.
Connect with R
All of the above is probably overkill if all you’re looking to do is to keep track of how many sodas you’ve had in one day. (Yeah, but then use the time stamp feature and the timeline to figure out when you’re having all of those sodas!) But if Google Docs doesn’t quite have the power you’re looking for, you can easily pull your data into R and really get your hands dirty.
Getting the data into R takes 2 steps:
- Publish the data to the web.
- Grab the data from the CSV URL into R.
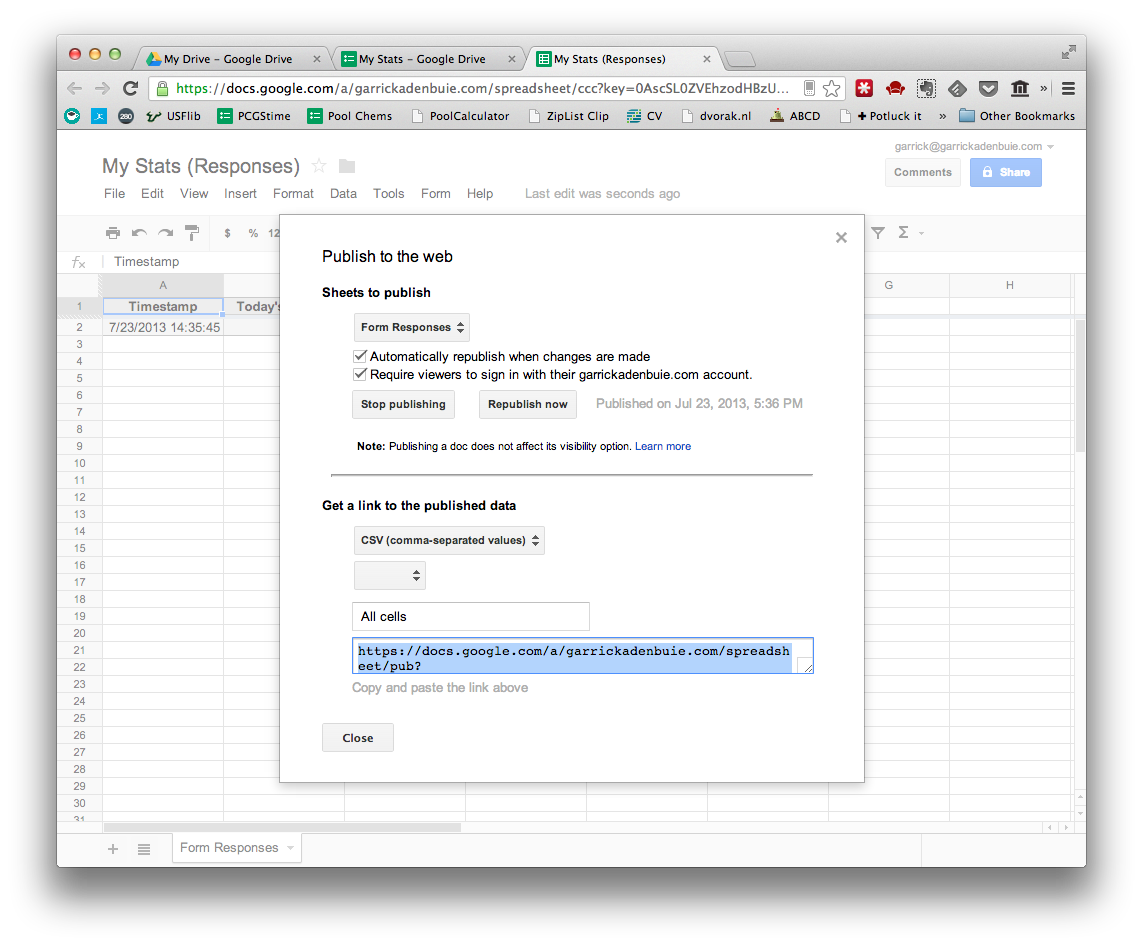
It’s that easy. To publish the data to the web, click “Publish to web” under the File menu in the Google Docs spreadsheet. Click Start publishing, and make sure that Automatically republish when changes are made is checked, but that Require viewers to sign in… isn’t. There may be a way to sign in from R, but I don’t know it.
Then, select CSV for the link you want, and copy the URL.
In R, use RCurl to pull the data as follows (you need RCURL to connect to HTTPS):
require(RCurl)
dataCSV <- getURL('copy URL here')
data <- read.csv(textConnection(dataCSV))
And you’re done! Happy data collecting!