Presentations, talks, and workshops.
brand.yml is an exciting new project from Posit that radically simplifies theming across reports, apps, and websites in R and Python.
A full-day workshop introducing participants to LLM APIs using ellmer (R) and chatlas (Python), covering system prompts, tool calling, RAG, and building Shiny apps with LLM-powered chat interfaces.
A live demo explaining LLM APIs from zero and building LLM-empowered data workflows and Shiny apps using ellmer, shinychat, and querychat.
A live demo showing how to build custom LLM-empowered data workflows and Shiny apps using ellmer, shinychat, and querychat.
A live demo of brand.yml, showing how to create beautifully branded Shiny apps, Quarto reports, and slides from a single YAML configuration file.
An introduction to brand.yml, a new Posit project that radically simplifies theming for Shiny apps and other R data science outputs.
A hands-on workshop covering the latest developments in bslib for building modern, themeable Shiny apps and dashboards.
bslib is the new shinydashboard! Learn why you should choose blisb for your next Shiny app or dashboard.
Super glue for data-driven reports and Shiny apps.
{epoxy} is a new R package that allows report authors to seamlessly blend prose and data in markdown, HTML, and LaTeX reports.
A useR!2021 tutorial about making great slides with xaringan.
Make stylish slides with {xaringanthemer} and a little bit of CSS.
A brief introduction to the {xaringan} package and how you can make your slides look great with {xaringanthemer} and stand out with {xaringanExtra}.
An incomplete history of the literate programming origins of R Markdown. Plus some cool things I’m tinkering with: {epoxy} and {shinyComponents}.
Making slides with xaringan is a great way to learn more about CSS and web development.
Scale high-quality research data provisioning with R packages package.
A presentation writing and benefiting from programming with functions.
A two-day workshop to get you up and running with JavaScript in Shiny and interactive R Markdown documents.
A gentle introduction to reproducible data workflows with the {drake} package.
An intruction to data visualization with ggplot2 presented at the “Workshop on Data Analysis Using R” hosted by the ASA student chapter at USF.
Presented at the “Utilizing Technology for Data Collection and Intervention” mini-conference at Moffitt Cancer Center
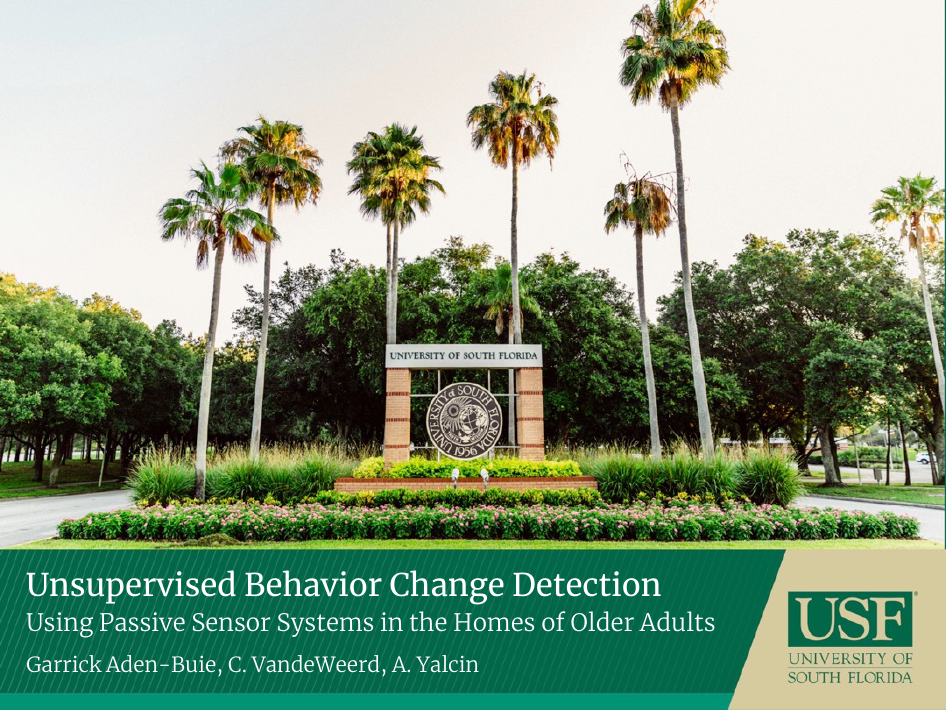
Presented at the 11th World Conference of Gerontechnology in St. Petersburg, FL.
An introduction to data visualization using ggplot2 presented at the Tampa R Users Group on 2018-01-23.